
Summary
In response to the client’s need to penetrate the US and/or Mexican soft drinks markets, a comprehensive analysis was conducted covering market performance, trends, and future outlook. Key insights include the establishment of a new status quo during the pandemics. Recommendations for Mexico emphasize health concerns, sustainability, and e-commerce, while in the US, the focus is on using natural ingredients, analysis on flavor, and sustainability. The concise 5-slide presentation ensures the client receives crucial information efficiently for their imminent board meeting.
Achievements
- Market Analysis & C-Level Presentation
- Performed a thorough analysis of carbonated drink performance and trends in Mexico and the US, spanning from 2016 to projected data for 2026, for presentation at the C-level.
- Quantitative and Statistical Support
- Supported arguments with data from the Google Trends API, including data from autosuggest and insights from articles by company-affiliated market researchers
- Actionable Recommendations
- Formulated actionable recommendations tailored to each market, addressing consume trends, health concerns, sustainability, and e-commerce channel investment.
Important
Due to confidenciality of the enterprise and data privacy, this project is not available to download. So I’ll limit myself to share brief supporting data I collected from external sources that do not make direct reference to Euromonitor’s reports.
Procedure
Objective
Client: A company within the global soft drinks industry, wants to enter to US and/or Mexico.
Need reported: Understand the trends in carbonates in Mexico and the US.
Notes: Ultimately, the client wants an overview of the immediate and short-term opportunities to further penetrate the market as part of their business strategy and planning.
Exploration
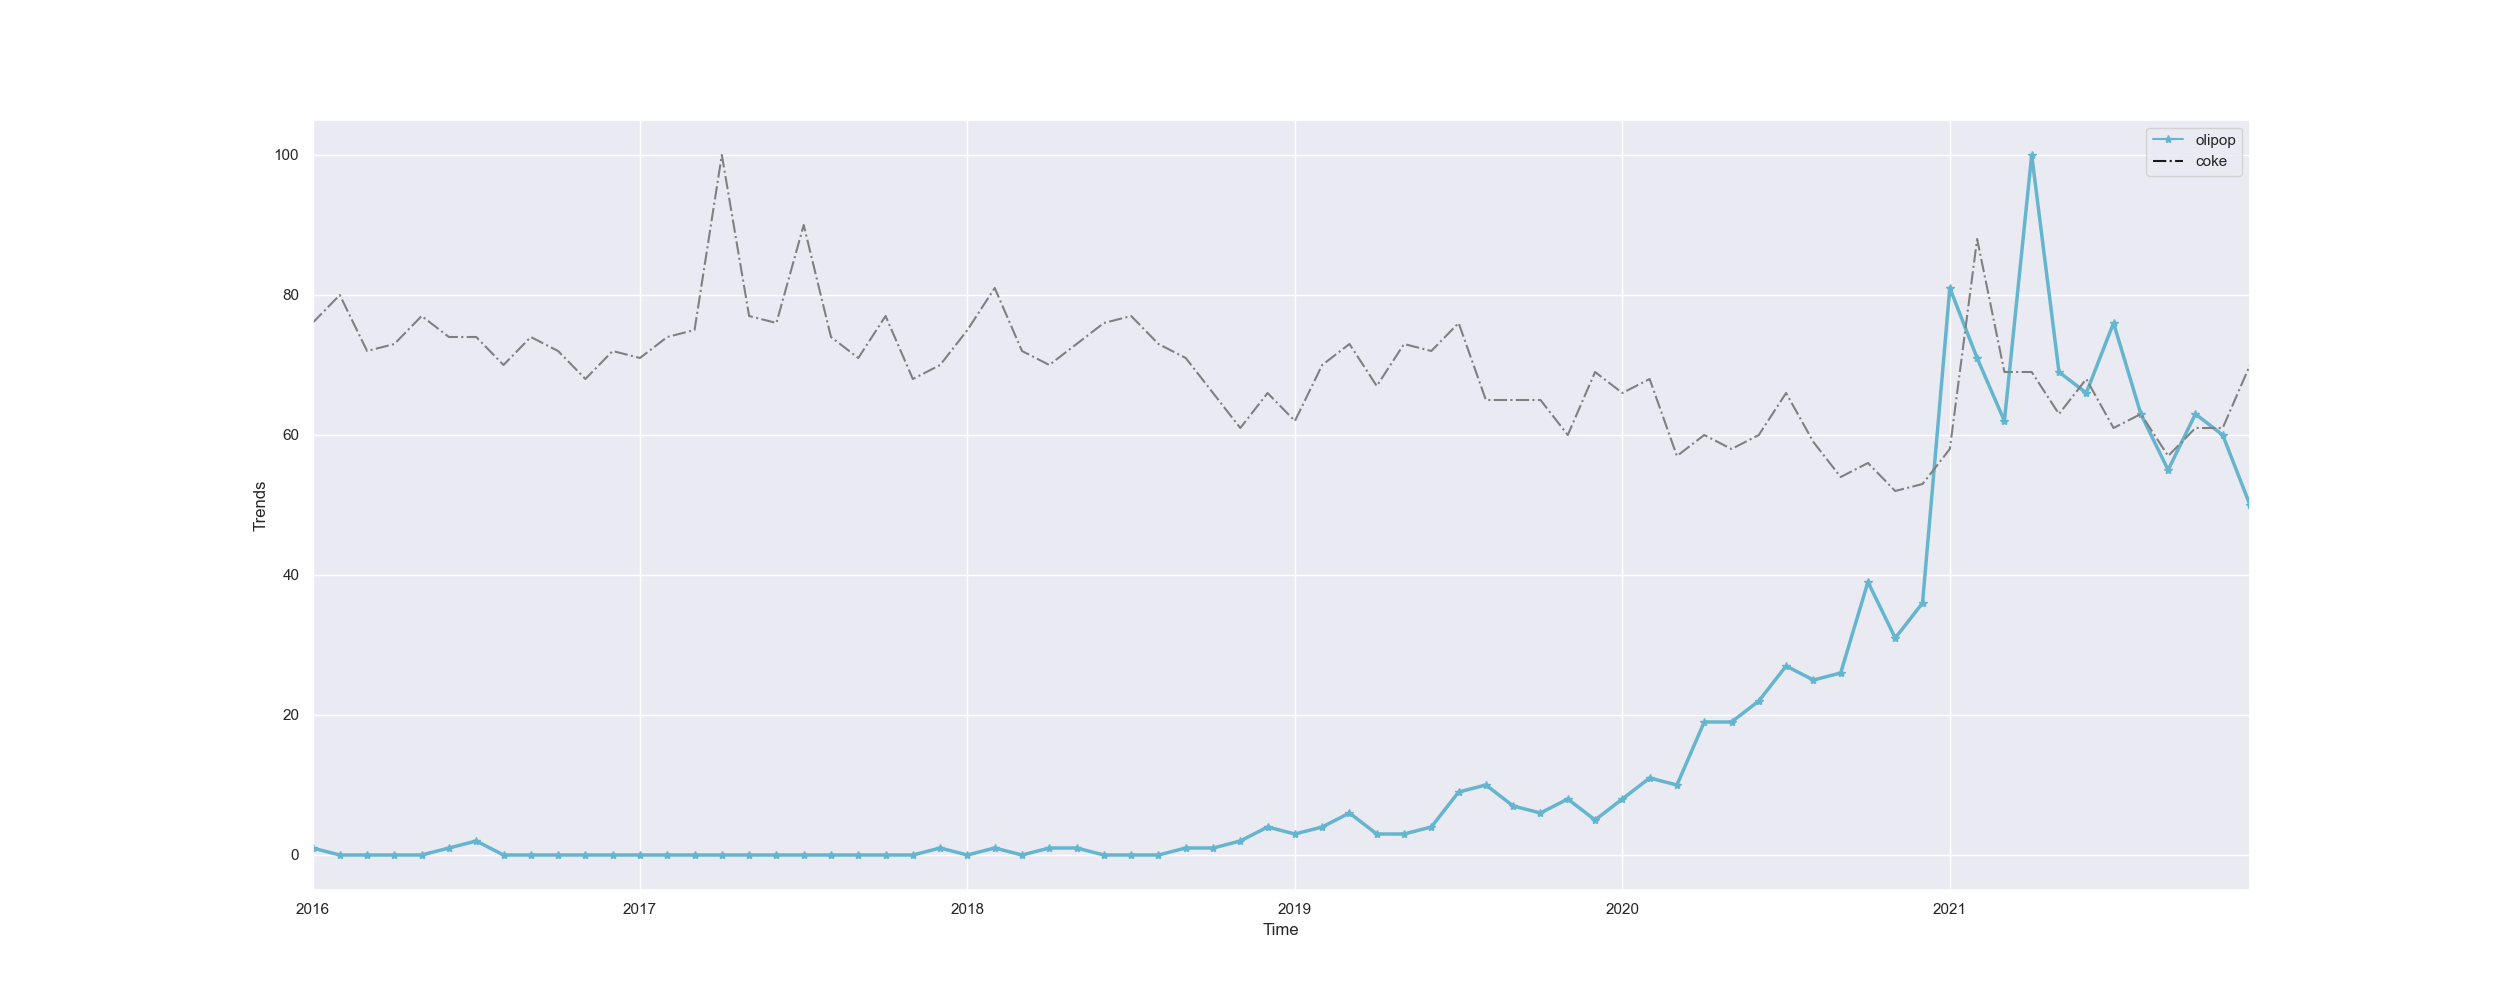
Besides the statistics provided by the market researchers at Euromonitor, I requested data to Google Trends to analyze the interest of certain products and services on given time periods. For example, something quiet relevant is the introduction and popularity of Olipop: “A new kind of soda that supports digestive health”.
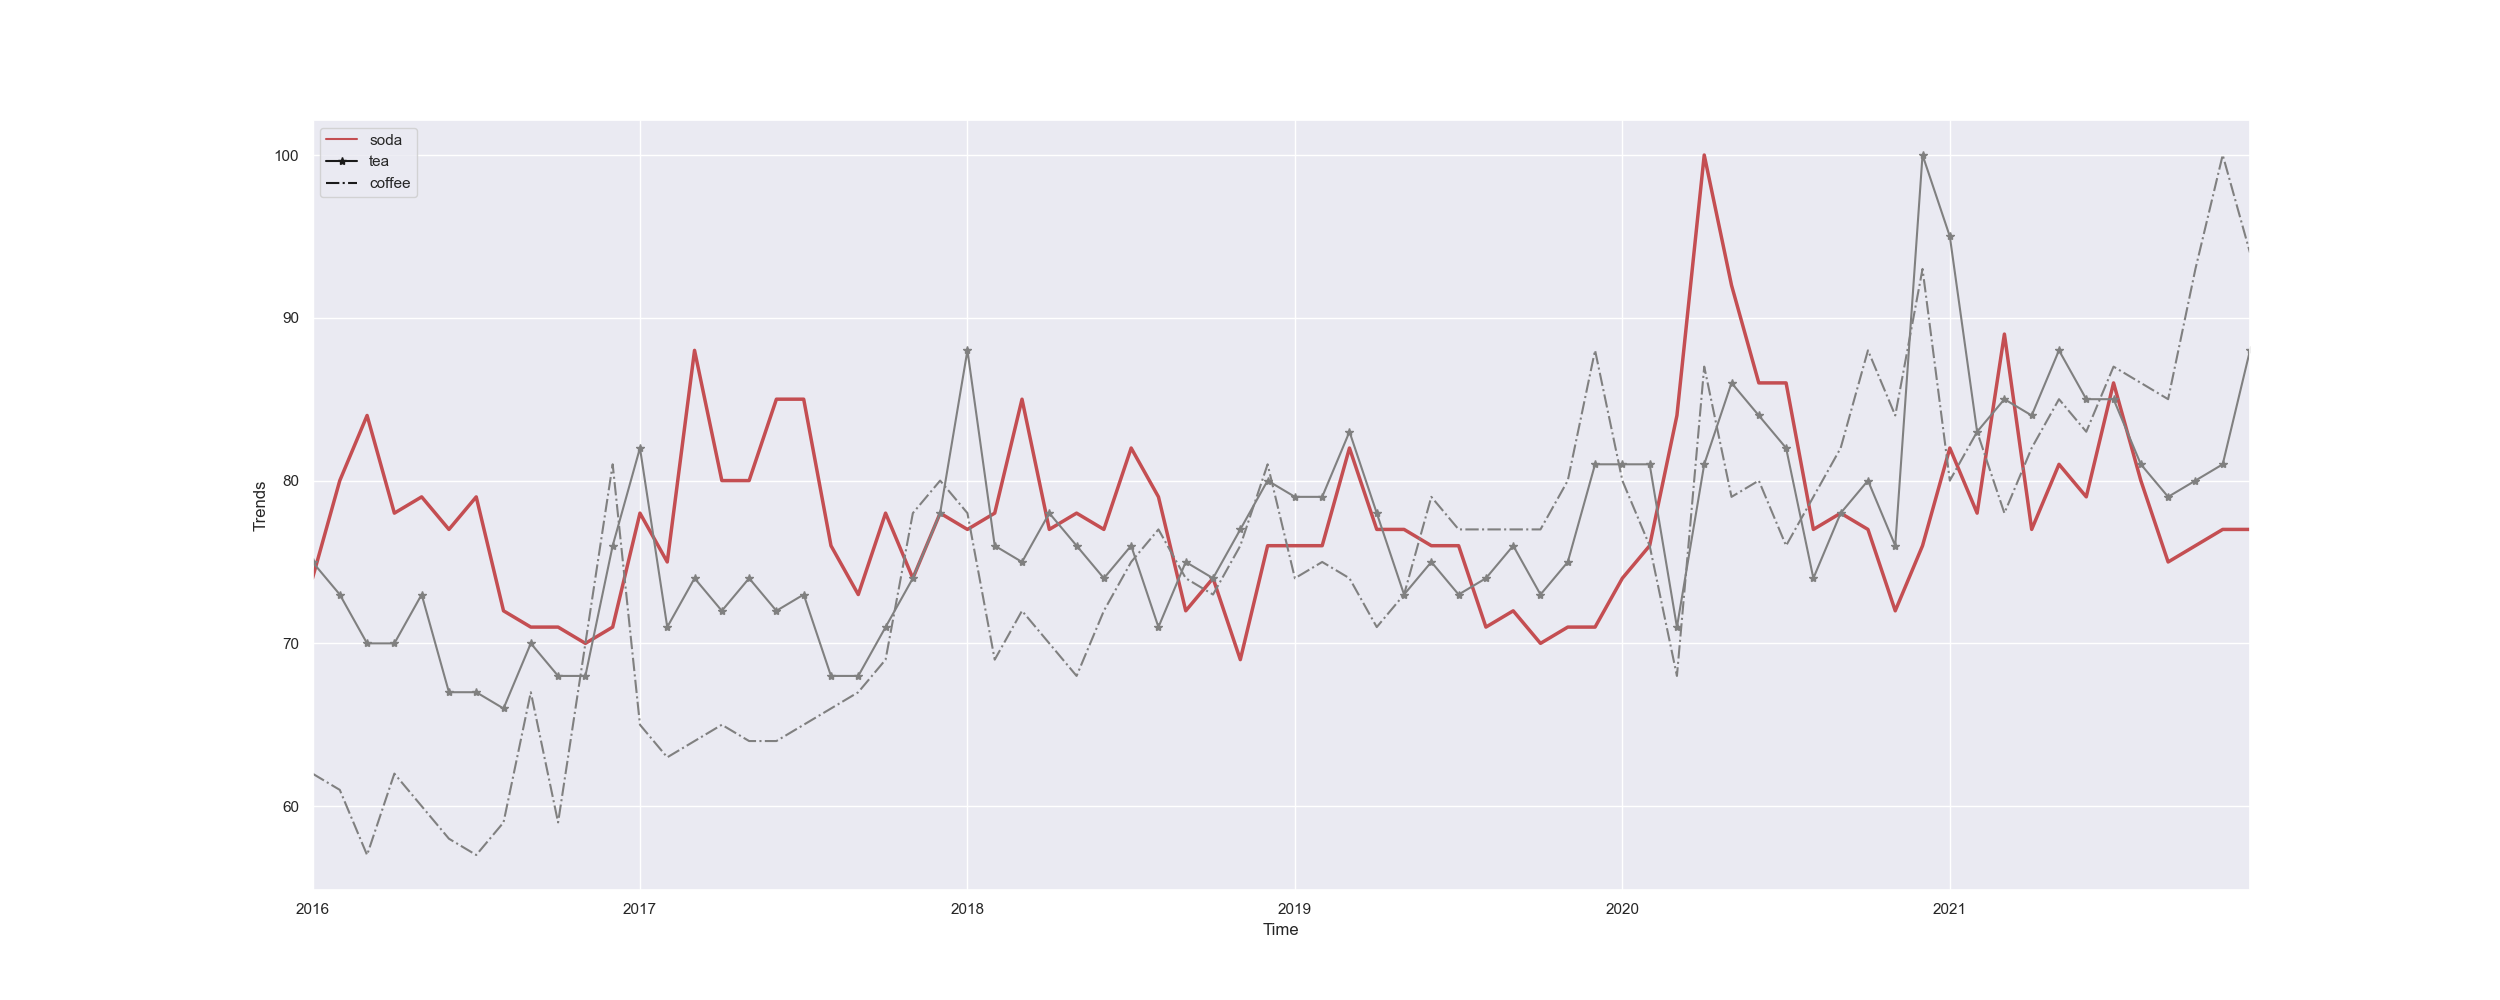
Also, consumers began to care more about their health, which can be seen by exploring the popularity of the terms ‘soda’ vs ‘coffee’ vs ‘tea’ on search engines.
Insights
I fear I am not able to share my insights because they are all about strategic measures, trends and recommendations elaborated from the Company’s intel.