

Summary
In response to a Marketing Campaign Analysis challenge, I conducted a robust ETL pipeline using Pandas, extracting and transforming the data before loading it into MySQL. The subsequent statistical analysis addressed crucial business questions related to web purchases, campaign success, product performance, and channel effectiveness. I identified potential growth opportunities in Mexico based on spending patterns, proposing a strategic focus on web purchases and consumer insights through marketing campaigns. The approach is detailed in the following: Files within a Github Reporitory and a Tableau Dashboard.
Achievements
- Opportunity Detection and Strategy
- In an exploration exercise, Identified a strategic growth opportunity revealing the potential of the Mexican market. Yielding triple the income compared to the nearest country in online purchases, the USA.
- Data Strategy
- Due to the limited data from Mexico, I suggested and supported a strategy using data. This aims to overcome the shortage of insights and gather the necessary information to validate our hypothesis.
- Statistical Analysis and Dashboard Creation
- Utilized statistical analysis to answer key business questions and presented the findings through an interactive Tableau dashboard.
- Developed an ETL Pipeline
- Analyzed customer behavior and trends from 2,240 profiles, and provided a full ETL pipeline.
Details
‘Maven Analytics’ uploaded a Marketing Campaign dataset (2,240 customers) which includes customers profiles, product preferences, campaign successes (or failures) and performance. Following their recommendations as a guideline, I did a whole ETL pipeline process: extracted the data, cleaned and transformed the dataset using Pandas, exported the processed file (as CSV) and loaded the set to MySQL (through pymsql).
Here are the questions posted in the challenge:
- What factors are significantly related to the number of web purchases?
- Which marketing campaign was the most successful?
- Which products are performing best?
- Which channels are underperforming?
Questions 3 and 4 are easy to solve and to show through a chart (Tableau), but what seemed like a more interesting question, to me at least, was Q1. To address it, the first step was to finish with the data wrangling process, and then to search for clues by computing a correlation between variables.
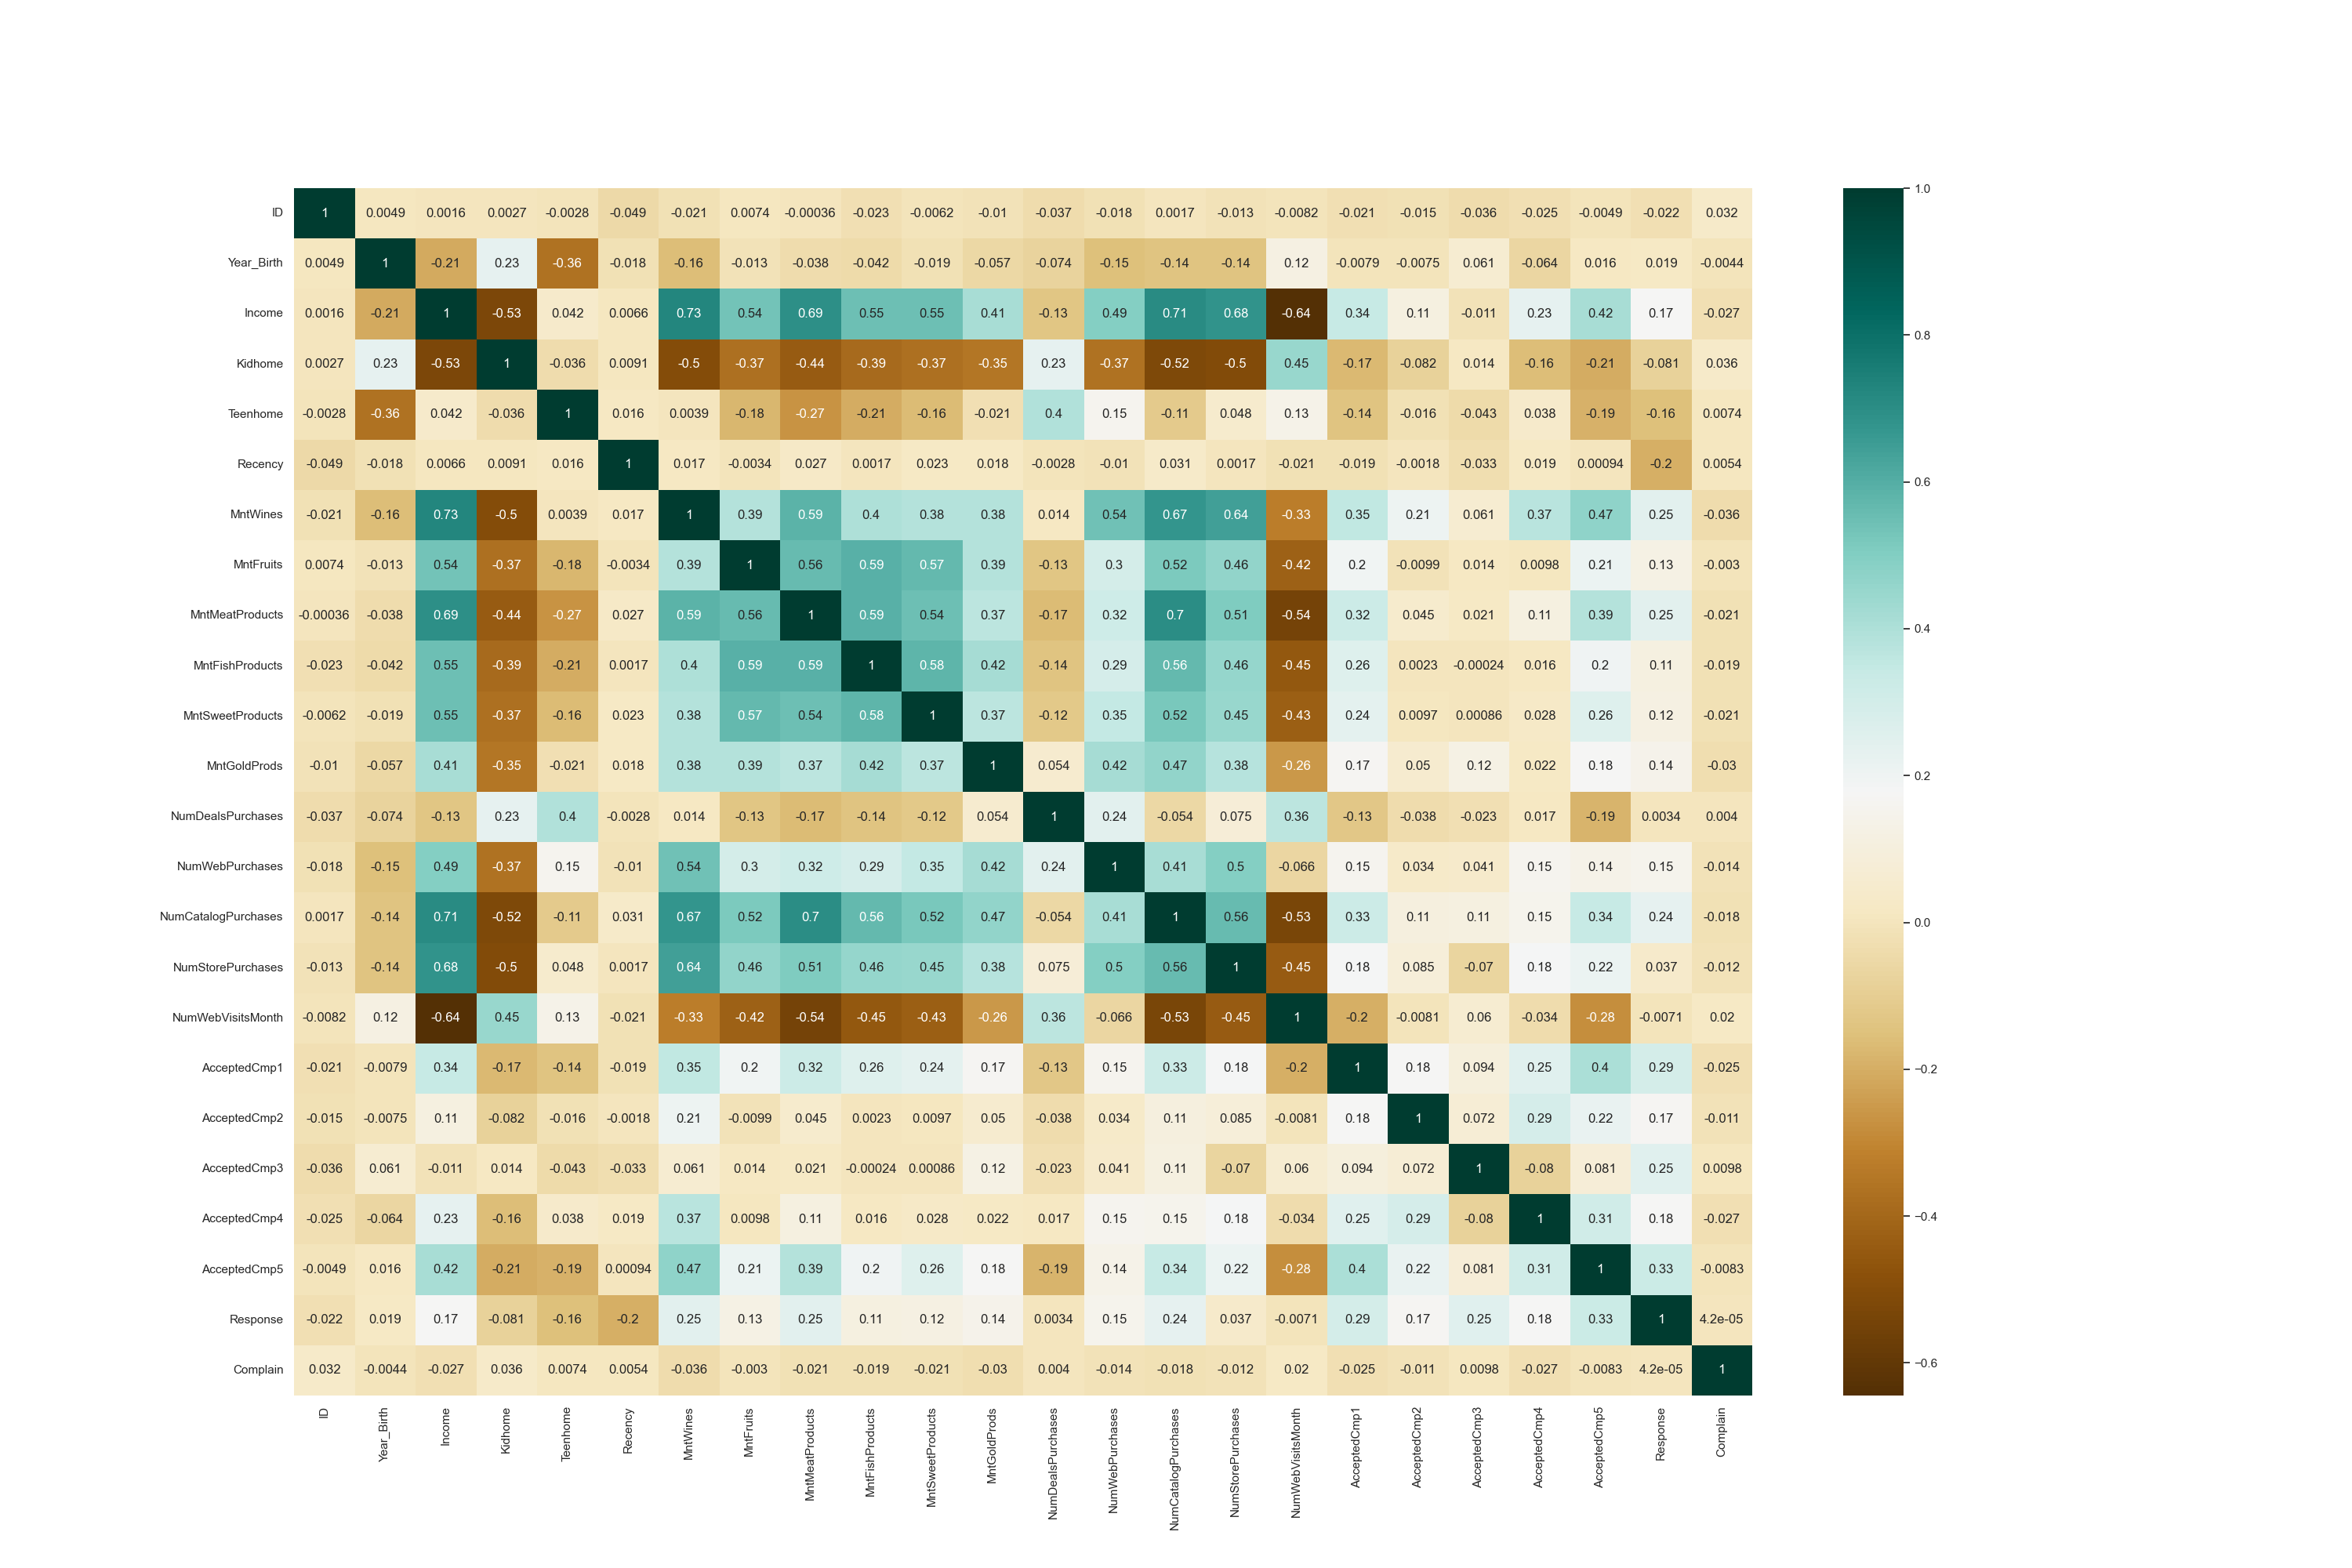
Full size imagen available here
Opportunity: Mexican Market
Something that came up via an exploration exercise: if you take the average of the amount each Country spends on each product category, Mexico shows a considerably higher commercial atractive, specially in wine and meat. There is a problem though, there are only 59 registers, and there is no evidence for they to be considered “randomly sampled”, thus I consider that there is not enough data to validate the hypothesis.
To overcome the shortage of insights and gather the necessary information, I proposed to focus on web purchases, grow a database, and gain insights on the consumer behaviors and patterns through marketing campaigns and surveys. To do this, like on any other country, focus on the global average consumer. Due to Mexico’s economy, I suspected that the target consumer had to deviate a bit, however, India’s GDP(PPP) is even lower than Mexico’s and their average consumer does not deviate that much from the global average.
Be sure to check both tabs in the Tableau Dashboard! ;)